

Voyager LECP Data Analysis Handbook
In-Flight Calibration Studies
Study of Voyager 2 LECP Responses in Partial Exposure ("Chicken") Mode
Thomas P. Armstrong
and
Dong Feng Lu
Department of Physics
and Astronomy
University of Kansas
Lawrence, KS 66045
August 15, 1986
Introduction
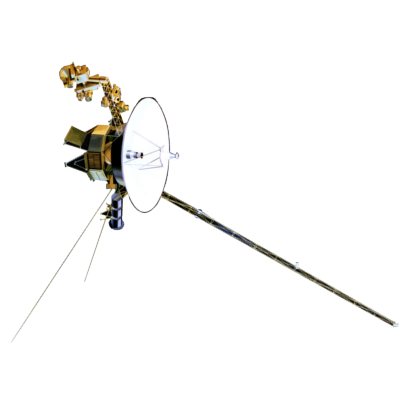
The Voyager 2 LECP instrument was put in a special mode for about three days centered approximately on Jupiter periapsis in order to protect it from radiation exposure which might have impaired its ability to complete its expected observations at Saturn and Uranus. Experience has validated this conservative approach which was taken by the LECP team (really, Ed Keath and Ernie Franzegrote worked it out and Tom Krimigis had the courage to use it) in that the LECP instrument has performed very well up to the date of this report. Nevertheless, the chicken mode was not a laboratory calibrated and engineered function of the LECP instrument, and the precise values for the reduction in exposed area and solid angle have been the subject of some uncertainty. In the principal reports on LECP chicken mode Jupiter observations up to this time, a value of 4% (or 96% reduction) of the full sensitivity values has been used. The flux values derived from this have been used to compute hot plasma densities fully consistent with other determinations (most notably the Voyager Plasma Wave instrument values of total plasma density determined by measurements of the plasma frequency).
Laboratory experimentation with a spare LECP unit at the Johns Hopkins University Applied Physics Laboratory by John Kohl and careful evaluations of the geometry by Ted Mueller (also of JHU/APL) are roughly consistent with this 4% value.
In this report, we present a retrospective analysis of the count rate transitions experienced by the LECP instrument during the entry into and the exit from the "chicken" mode in-flight. As described above, this is only one of the approaches to the determination of the reduction in the sensitivity of the various LECP channels. Inherent in this approach is the assumption that the environment remained stable for approximately 10 to 30 minutes during the transition and that the angular distribution of the arriving radiation during the transition was smooth (at least not varying too severely over the few degrees in question). As will be seen in the course of the following discussion and analysis, it is likely that the inbound entry satisfied these conditions less accurately than the outbound exit.
Analysis of PL0 (detector A) Responses
By inspection of Table 1, it can be seen that the ratios for the PL0 channels are more consistent with each other on the outbound exit than for the inbound entry. The average of the 8 ratios for the outbound exit is very close to 24 with a range from 17.6 to 30. A ratio of 24 corresponds very closely to the 4% sensitivity adopted in the earlier studies. The inbound ratios are smaller than the outbound ratios for all channels except PL07 and PL08, ranging from 3.853 to 23.553. Neglecting the extreme high and low values, the average of the 6 remaining ratios is very close to 15—corresponding to an efficiency of about 6.7% relative to the full, open sensitivity. Inspection of the plots versus time of the inbound and outbound count rates reveals somewhat more fluctuation versus time during the inbound interval. Also, the count rate variations apparent during stepping are more severe during the inbound interval. The PL0 channels are especially sensitive to the corotating hot plasma flow which probably produces a sharp peak in the angular response near sector 7 and the "chicken" sector direction on the inbound interval but not on the outbound. Given the simpler behavior of the count rates versus time and angle for the outbound data, I suggest adopting the value from the outbound transition for the "chicken" mode sensitivity. In effect, this means to continue using the 4% adopted sensitivity. Table 2 (after Krimigis et al., 1981) summarizes the normal and "chicken" mode geometrical factors and sensitivities.
Before leaving the discussion of the PL0 responses, we should note that it is likely that there is at least some dependence of the "chicken" mode sensitivity on energy. The LEMS aperture does contain a magnetic field designed to sweep away the low energy electrons from the low energy (A) detector. There is necessarily some curvature of the ion trajectories also. Since the "chicken" mode exposes solid angle only near the edge of the aperture, even small deflections of the ion trajectories in the aperture may affect the access to the detector. This is geometrically complicated and very difficult to estimate. The pattern of outbound ratios suggests that this effect must be no larger than a few percent. The most reasonable procedure is to use the constant (with energy) adopted value and to be aware that spectral shapes derived thereby may be subject to a few percent relative uncertainty.
The effect of dead time due to count rate and amplitude dependent electronic non-linearities has not been included in the data of Table 1 or in the plots versus time. Extensive evaluation of the performance of an identical system of Voyager 1 near Jupiter periapsis has been used to establish a "correction" procedure. Because this procedure requires all PL0 data simultaneously and corrects it all, it has not been applied here. The highest time resolution sampling of the PL0 data is not time-commensurate on all channels and interpolations would be required. The corrections would be quantitatively small in this case because the integrated rate in all channels is only about 30,000 counts/sec. The corrections for this integrated rate would be about at the level of the log-compression error of ½%.
Analysis of E0(E2) and E0(E3) Logics
The LEPT system has a mosaic of three detectors (E0, E1A, E1C) at its entrance. The geometrical relationship between each of the mosaic detectors and the shield is different. Hence we must consider the channels generated by each of the detectors separately.
- Channels 38 and 39
These channels are singles rates in E0 set at thresholds high enough in this 2 micron thick detector so that they respond to medium nuclei and heavier (channel 38) and Helium nuclei and heavier (channel 39). The inbound and outbound ratios of channel 38 are 57.021 and 55.827, respectively, while those of channel 39 are 26.254 and 57.965. In view of the fluctuations in the inbound data for the PL0 channels and the apparent consistency among the other three evaluations of this logical condition, it appears that a value of 57 probably represents the geometrical condition accurately for the E0 detector in the "chicken" mode. This would correspond to 1.75% of the full sensitivity. We adopt this value for the tabulation given in Table 3.
- Channels 32, 33, and 35
These channels are E0 E2 coincidence channels with vetoing from E3. It follows from the logic that the sensitivities of these channels cannot be higher than those of channels 38 and 39. Indeed, the ratios for channels 32, 33, and 35 are higher than those for 38 and 39 in all cases except for channel 35 inbound. Given the consistency of the outbound ratios among channel 32, 33, and 35, it would appear that an average ratio (84 in this case) would appropriately represent the sensitivity of the E0 E2 (E3) logic in the "chicken" mode. This would correspond to 1.19% of full sensitivity.
- Channels 1 and 3
These channels are formed from (E1A or E1B) E2 (E3) logic. By inspection of the time series plot for channel 3, it can be ascertained that its "chicken" mode response is dominated by background. This can also be surmised from the listed average rates in Table 1. Hence it is a poor channel to use in establishing the geometrical reduction in sensitivity due to the "chicken" mode for the E1 E2 logics. The most trustworthy number appears to be from channel 1 outbound, about 65. Taking that as the best estimate yields a sensitivity of 1.54% of full for the E1 E2 (E3) logics. This sensitivity is used in the calculation of Table 3 values.
- Table 1 - List of "before/after" count rate ratios for inbound entry and outbound exit from Chicken Mode
- Table 2 - Voyager 2 LECP PLO (Detector A) characteristics
- Table 3 - Normal and chicken mode geometric factors
- Table 4 - List of times used in forming Table 1 averages
- Plots
Return to Voyager
LECP Data Analysis Handbook Table of Contents.
Return to Fundamental
Technologies Home Page.
Updated 8/9/19, Cameron Crane
VOYAGER 1 ELAPSED TIME
*Since official launch
September 5, 1977, 12:56:00:00 UTC
VOYAGER 2 ELAPSED TIME
*Since official launch
August 20, 1977, 14:29:00:00 UTC
QUICK FACTS
Mission Duration: 40+ years have elapsed for both Voyager 1 and Voyager 2 (both are ongoing).
Destination: Their original destinations were Saturn and Jupiter. Their current destination is interstellar space.